Professor Greg Marsden
Reference as: Marsden, G. (2020) The Role of Sub-National Transport Bodies in Carbon Governance, DecarboN8 working paper 3.1
Executive Summary
This paper reviews the role of Sub-National Transport Bodies in Carbon Governance in England. It reviews the formal accounting framework, the coherence in carbon terms of trying to manage carbon at different scales and the availability of policy levers at those scales.
Carbon governance is a complex issue. There is no one right answer as to where to intervene to manage carbon. Ultimately decarbonisation has to happen everywhere and so all scales have some role. However, this paper sought to explore the need for intervention by Sub-National Transport Bodies. It concludes that there is a strong case for SNTBs to be involved in carbon governance. The key arguments for this are:
- There is a strong coherence from a mobility perspective to understand carbon at a SNTB scale. This scale captures the majority of carbon from transport generated in that area. Smaller spatial scales are less optimal as more of the flow is through traffic and the levers to intervene more limited.
- Whilst previously a national approach has been adopted, it is clear that there is so much diversity within an SNTB area that there could be benefits to coordination at this scale to understand when coordination is beneficial or necessary and to understand the cost and delivery trade-offs of different local approaches
- There is already groundswell of bottom up initiatives which is working against coherent carbon governance and will, in the absence of coordinating actions, lead to competition and potentially sub-optimal spend and policy outcomes.
It is worth noting that the devolved administrations of Scotland and Wales already have spatially segregated carbon governance and the emissions contributions of these administrations are smaller than many of the existing or proposed SNTBs.
However, SNTBs can only act as coordinators of the transport carbon governance picture. They lack the powers to influence carbon policy on the ground and are someway removed from the local demands for action which have led to the declarations of climate emergencies. Strong democratic accountability and political mandates to take what will amount to radical action are critical. Such mandates cannot be achieved by more technical issue-led bodies such as SNTBs where the mandate is someway removed from the electorate (despite the buy in of those partner organisations). There are also other policy areas which lower tiers of government are responsible for where carbon and other policy trade-offs and integration with transport actions need to be considered. These issues fall outside the remit of SNTBs. Done well, SNTBs can coordinate the introduction of innovations at scale and can help improve the analytical and decision-making capacity of all of the authorities in their areas. This should enable more coherent business cases to be built which deal with the risks and trade-offs which seem inevitable given the complexity of decarbonising the transport sector and the wide diversity of start points. Without intervention from SNTBs it is my assessment that there will be a very uneven approach to understanding the carbon issue, coupled with strategies of differing levels of ambition which, in turn, will raise tensions about resourcing to back those up.
The paper concludes by looking at Transport for the North as a case study SNTB and identifies four major roles it could potentially fulfil:
- Improving carbon accounting
- Ensuring effective prioritisation and value for money in carbon pathways
- Facilitating and coordinating cross-boundary technology transitions
- Incorporating embodied emissions from infrastructure in programme planning
At this stage, those roles are indicative and require further investigation to be certain that there is demonstrable value added.
1. Carbon Accounting in the UK
1.1 The UK and Devolved Administrations
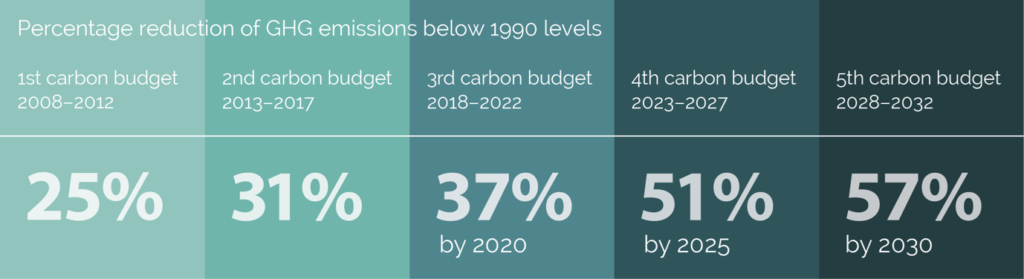
The United Kingdom (UK) Government has set a UK-wide target under the Climate Change Act 2008 and Climate Change Act 2008 (2050 Target amendment). This means cutting emissions by 100% by 2050 with a series of five year budget periods set along the route. This represents the UK’s contribution to the ‘Paris Agreement’ which sets out a global framework to limit global warming to well below 2°C and pursuing efforts to limit it to 1.5°C above pre-industrial levels. The interim budgets are set on the advice of the Committee on Climate Change with the current budgets shown in Figure 1.
Carbon accounting is part of the UNFCC international framework and it is based on nationally determined contributions and commitments. As such, there are no specific targets for the devolved administrations or any other spatial governance unit under the Climate Change Act. With the lack of specific targets in the Climate Change Act, Scotland produced its own Climate Change (Scotland) Act in 2009 which targetted a reduction in emissions of 42% by 2020 and they are aiming for zero emissions by 2045. Under its Environment (Wales) Act 2016, Wales has also formally committed to a budget led approach to meeting climate goals. There is no formalised commitment for Northern Ireland.
Whilst there has been action from the devolved administrations, and whilst the Committee on Climate Change analyses the performance and the potential emissions reductions across the devolved administrations, the UK achieves or fails on its commitments as a whole and has, hitherto, been resistant to breaking down the UK target to lower spatial scales within England.
The reasons for this are unclear. However, it is important to acknowledge that in 2003 the Energy White Paper was estimating that a 60% reduction by 2050 would be possible. In 2008 this was increased to 80% with the Climate Change Act and only in 2019 did the UK target move to 100% cuts. It had been argued that setting targets for areas or sectors might raise the costs of decarbonisation as efforts may have to then be focussed on places which were harder and more costly to achieve reductions. It is only under a 100% commitment that arguments about the potentially distortive economic effects of setting regional or sectoral targets diminish. Everywhere needs to cut emissions in every sector by 100% on a steep trajectory and within 30 years. Arguments about the best approach for governing carbon reduction might now best be taken on the basis of the specific sector and area combinations. This note focuses on the case for considering carbon targets and governance at a Sub-National Transport Body (SNTB) scale for the transport sector.
1.2 Local Climate Action
Before turning to analysis which can inform the role of SNTBs in carbon governance it is important to consider the forces which influence from the bottom up. Whilst they are formally disconnected from the UNFCC protocols, they are no less important to considerations of governance at an SNTB scale.
Research for the DecarboN8 network has examined the commitments of the 182 English councils that had declared climate emergency as of May 2020. Of these authorities: [1]
- just over one quarter (27.5 per cent) have set carbon targets for county-, borough- or city-wide activities and infrastructure across all activities.
- Fewer than one in ten (8.2 per cent) have set a specific transport emissions reduction target for the county/borough level, and not all of these have interim budgets.
- A further one in five (19.2 per cent) have set targets only for own council operations and buildings.
- Around forty per cent of authorities that have declared a climate emergency have done so without setting any targets.
Whether or not national government recognises the importance of spatial disaggregation of carbon commitments there is a de facto sub-national allocation of commitments being made. One of the advantages of the setting of targets at a local scale is that this ties the politics of climate to the politics of actions to tackle climate, at least in theory. However, the data suggests that the declarations are being made without a clear understanding of the science (as shown by the lack of trajectories) or the potential cost implications of the specific declarations (as shown by the existence of many target dates before 2040). This note does not take a view as to the rights and wrongs of specific carbon declarations, it simply identifies that ignoring carbon governance at a sub-national scale is resulting in the very same set of concerns on disjointed and less cost effective approaches which it was believed that specifying sub-national commitments would produce.
2 Transport and Carbon in the UK
2.1 Overall Emissions
Surface transport comprises 23% of UK greenhouse gas emissions. Taken together with aviation and maritime that rises to 33%, the UK’s largest sector. The trajectory for transport emissions has been flat for 30 years. Figure 2 shows the national breakdown of the contribution of emissions from different modes.
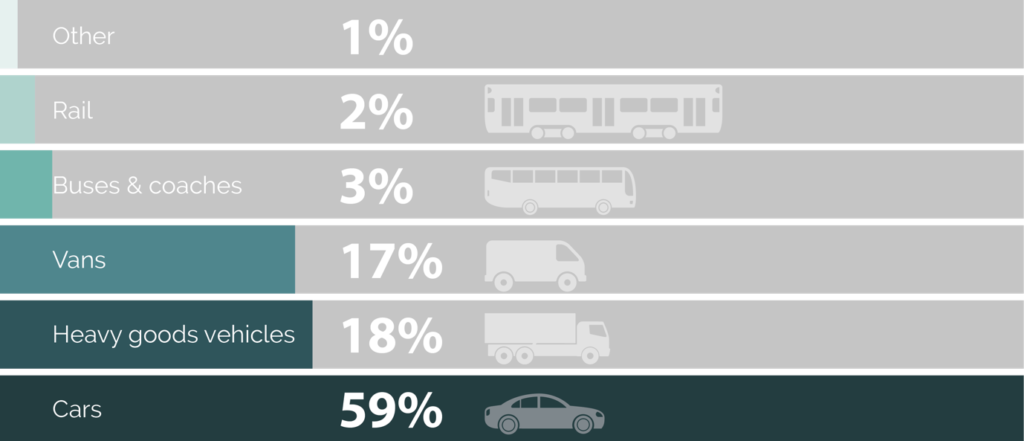
97% of emissions are from road based sources and the remainder of the analysis of carbon will focus on these emissions. This does not mean rail is unimportant. It plays a role in taking large numbers of car miles off the road in a year, but its contribution to the debate about what scale it makes sense to think about carbon governance is relatively unimportant.
Figure 3 below uses data from the National Atmospheric Emissions Inventory, which estimates emissions based on counts of flow on roads, speed and assumptions of average fleet age. It compares the emissions across different large spatial scales. This includes Scotland and Wales and various sub-national transport bodies that have either been established (e.g. TfN and London), exist as voluntary bodies (e.g. Transport for the South East) or have been discussed but not formed (e.g. Transport for the South West Peninsula). Northern Ireland has been excluded due to data compatability issues with some of the other comparative analysis which has been undertaken.
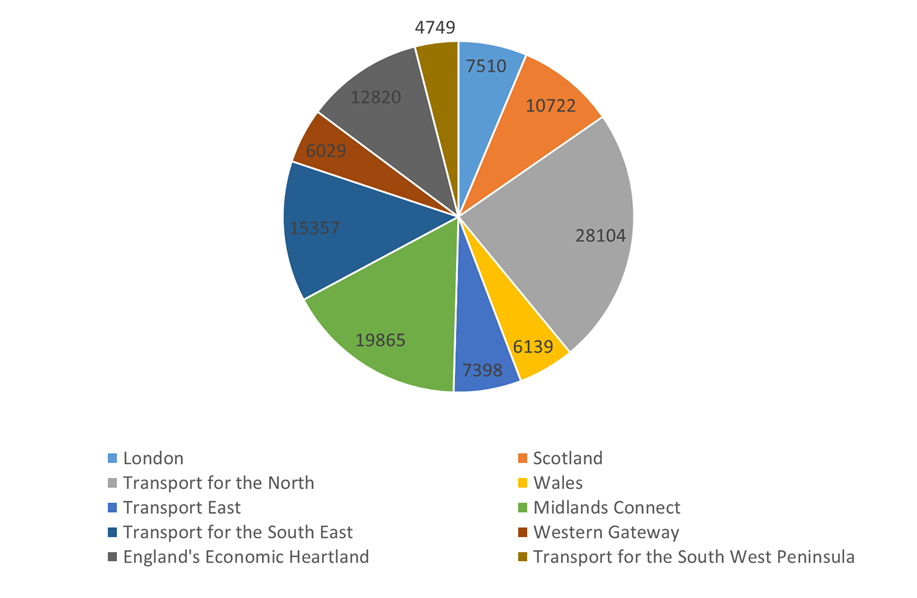
Of the 10 bodies listed, Wales is 7th and Scotland 5th in terms of total contribution. Transport for the North is the largest contributor (24% of emissions), reflecting the large geographic reach and population (15.25m) compared with Midlands Connect, the second largest contributor (17%) with a population of 9.9m. The current carbon governance picture therefore finds formalised sub-national commitments in place for 2 of 10 areas (Wales and Scotland) which are responsible for 14% of the transport emissions in Great Britain. There is not, therefore, a clear scalar argument as to why other Sub-National Transport Bodies could not have such responsibilities.
2.2 Sub-national or smaller?
There are two dynamics to consider when thinking about the benefits and disbenefits of setting budgets at different spatial scales. These are:
- The coherence of the boundary selected
- The powers to act on the emissions within the boundary selected
These issues need thinking through at whatever set of scales are used because even in a two-tier “national-local” dichotomy they matter. There is not one right answer for the selection, it is about the parties involved recognising the strengths and weaknesses of their own scale and therefore on what issues it makes sense to work across bigger spatial scales.
The importance of scales can be understood by an analysis of the NAEI data using the smallest possible unit of governance which is unitary and county district level. This gives 371 units across England, Wales and Scotland. If through traffic dominates local traffic then both the coherence of the boundary and the ability to influence the carbon outcomes are low.
The charts below show the overall distribution of emissions and then the rank change when you exclude motorway emissions and when you exclude motorway and A road emissions. If the rank changes are close to zero then the spatial scale is not impacted by through traffic significantly and the coherence is high.
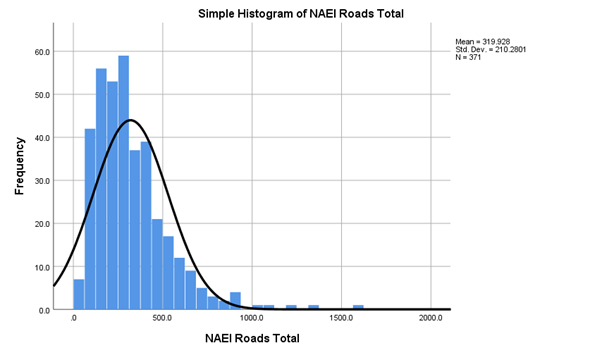
At this scale, the distribution is highly skewed with large urban districts such as Leeds and Birmingham appearing as outliers towards the top end, whilst small authorities such as Isles of Scilly appear at the left of the distribution. It is highly skewed but also exhibits significant variability.
Turning now to Figure 4b. Authorities are ranked as 1 if they are the lowest emissions and 371 if they are the highest. A negative rank change means that when you exclude motorway emissions they appear to perform worse (higher emitting relatively). It is clear from the very large amount of rank shifting that the contribution of motorway emissions contributes substantially to the overall position. This is problematic because it means that authorities with small populations are being assigned large emissions because they happen to have a segment of motorway in their area.
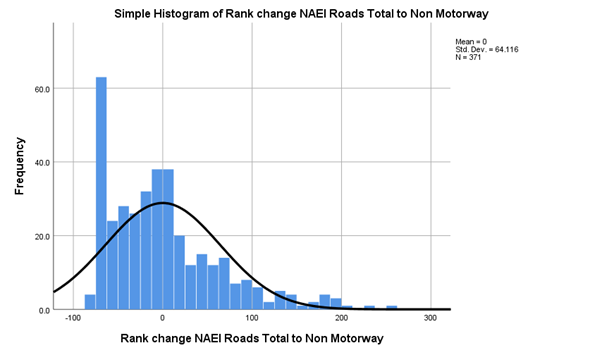
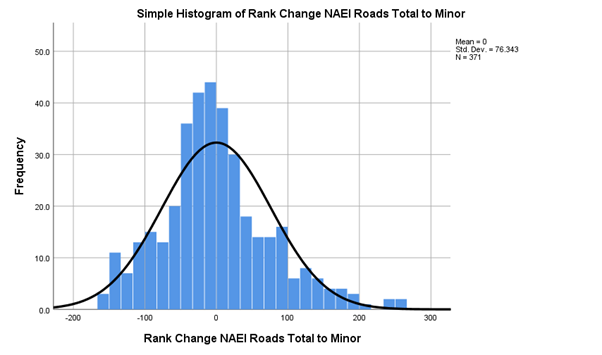
Figure 4c shows that the issue of performance differences does not just exist with motorways but A roads too. Whilst this exhibits a more normal distribution (as most authorities have some A-roads whereas only a few have motorways) the spread of rank shifting is wide (one third of changes are greater than 76 ranks different). This means that there could be very significant differences between volumes of local and through traffic.
From this analysis we can conclude that the very smallest spatial unit has low coherence for carbon governance. As we increase the size of the spatial unit considered we would expect the coherence to increase. This is shown in Figure 5. As the spatial area increases in size the importance of through traffic relative to movements within the area reduces.

A question for SNTBs is, therefore, whether there is a strong coherence argument for carbon governance at this scale. This will, to a large degree, be determined by typical trip distances, which are shown in Figure 6. This suggests that whilst 95% of trips are less than 35 miles in length (and therefore likely to be well matched to County and Combined Authority scale governance), this only corresponds to 64% of miles (and therefore carbon). It seems likely, therefore, that SNTBs will add value to the coherence of carbon governance.
In order to explore the added value of shifting scales, an analysis similar to that presented in Figure 4 has been conducted for three further spatial scales: district and county level; Combined Authority, county and Scottish Regional Transport Body scale and then Sub-national and devolved administration scale. Table 1 below shows a measure of the gains in coherence in shifting from the smallest spatial scale up to SNTB.[3]
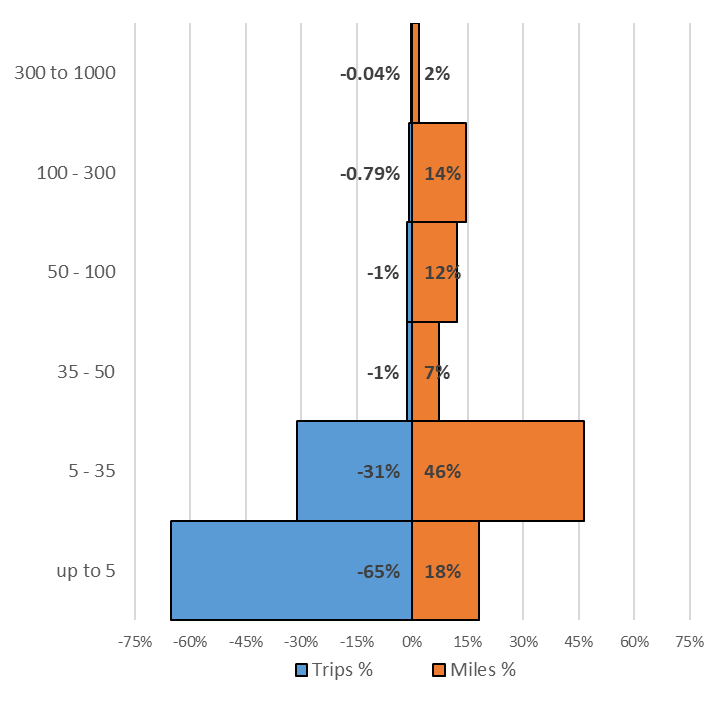
Table 1: Assessment of change in coherence through spatial aggregation
| Scale | % of total change in standard error |
| Counties and Urban Districts | 61% |
| Combined Authorities, Counties and Regional Transport Bodies | 79% |
| Sub-National and Devolved Administrations | 100% |
The analysis shows that the largest gains in coherence come from shifting from a district scale to a county and large unitary scale. However, there continue to be significant gains from moving up to a Combined Authority scale and again to Sub-National Transport Body level.
3 Powers
The second aspect of carbon governance is to consider where powers to act lie. Table 2 below reviews some of the key powers relating to carbon reduction in England. The aim of the table is to provide an indicative, rather than exhaustive, list of actions.
The table suggests that powers are held to a significant extent by national government. Beneath this tier the picture is complicated with actions spread across all actors, particularly from a Unitary or County level and up. As with thinking to deliver schemes based on congestion relief or air quality, joined up action is typically necessary across levels to deliver effective action. Mode shift for example requires road space reallocation at a highway authority scale but may also require mass transit investment at a combined authority level and, potentially, rail investment at a pan-regional level. Planning powers are concentrated at lower tiers but remain important to the nature of future travel patterns at a sub-national level.
There is no right or optimal combination of powers and spatial coherence. The more local one considers this, the greater the connection to democratic accountability but the lower the policy coherence and the more limited the policy toolbox. The larger the spatial scale, the more removed the decision-making is from citizens but the more comprehensive the consideration of all carbon from transport becomes.
This suggests a multi-level approach to carbon governance where there is co-ordination between adjacent areas at a local scale and planning at a sub-national scale to tackle the less frequent but important longer distance flows. Whilst, in theory, the task of co-ordinating around longer distance flows could fall to the Department for Transport, this would involve building capacity to understand the sub-regional differences and the connections between carbon and the wider social and economic benefits of transport investment in places. It would also potentially stifle bottom up creativity in finding least cost ways of addressing the carbon challenge. Such differences are already being reflected by the different approaches to carbon reduction being adopted in Scotland and Wales. To illustrate the scale of the diversity challenge Section 4 looks at differences within the Transport for the North Sub-National Transport Body.
Table 2: Powers to act on decarbonisation in England
| Layer | Fiscal | Regulatory | Infrastructural | P.T. Services | Planning |
| National | Fuel Duty Vehicle Excise Duty Company Car Tax | Emission standards; Charge Point Obligations; Highways England and Network Rail Reg Framework | Roads and Rail Investment Strategies Cycling Infrastructure Funding (LCWIP) Major Schemes and City Deals | Funding Framework Regulatory conditions Green purchase subsidy | Planning policy framework Housing targets and housing delivery grants |
| Sub-national | Strategic and Business case development | Lobbying | |||
| Combined authority | Strategic and Business case development and delivery | Managing socially necessary services Integrating information/ticketing | Advisory | ||
| County/Unitary/Met District | Parking Pricing | Strategic and Business case development and delivery Roadspace allocation | Managing socially necessary services Integrating information/ticketing | Strategic Plans (County) or Local Plans | |
| Local District | Parking Pricing | Charge points, parking bays | Local Plans |
4 Transport for the North: Carbon Diversity within the North
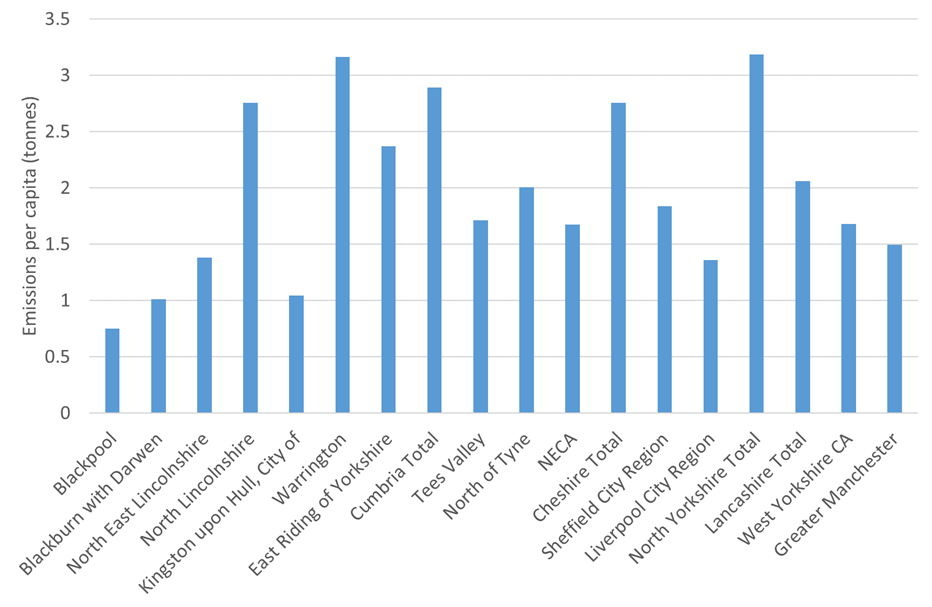
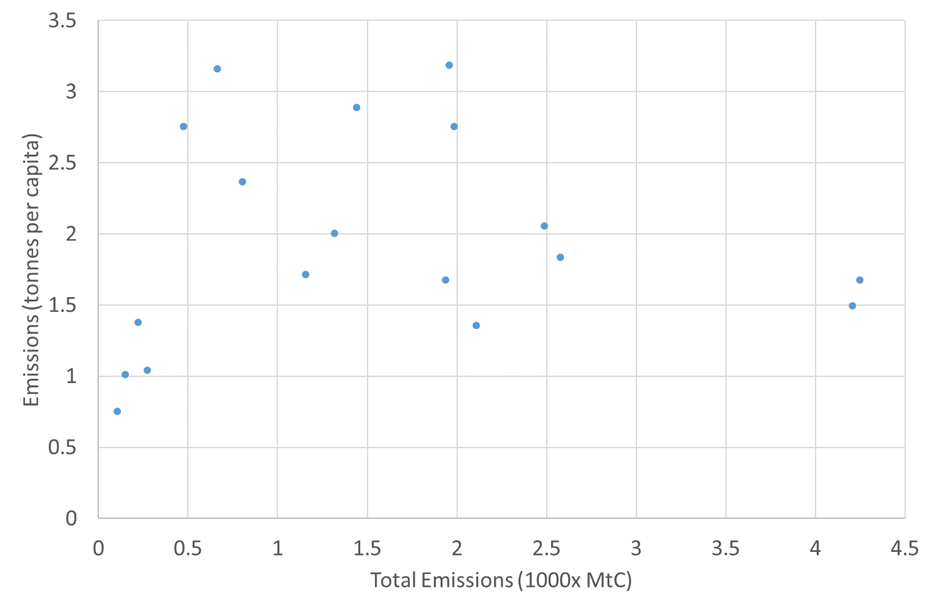
Figures 7, 8 and 9 show the distribution of carbon emissions as totals, emissions per capita and how the authorities compare on both metrics.
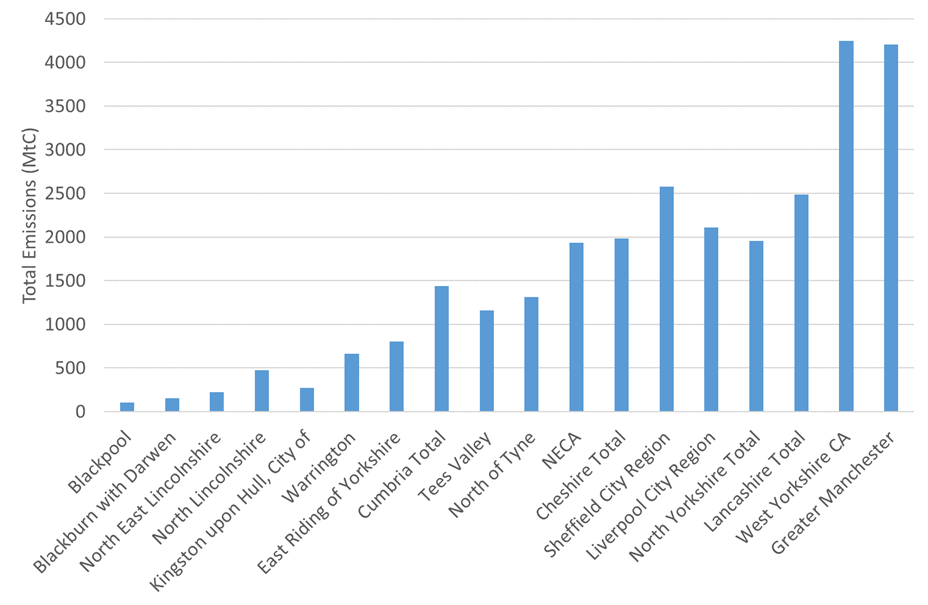
Figure 7 shows the wide diversity in size and scale of the emissions portfolio across the TfN area. Even within this area there is a mixed portfolio of scales and therefore coherence if carbon governance is left solely to the constituent areas. Of course, this could be broken down further within the Combined Authorities to their constituent urban metropolitan districts.
Figure 8 shows the same picture but on a per capita basis which helps to understand more about the start points of authorities beyond just how populated they are (which strongly influences Figure 7). Again, the range of start points is very significant. North Yorkshire has a per capita emissions level 4.2 times that of Blackpool and almost double that of its neighbouring West Yorkshire Combined Authority. Whilst there are many factors which play into this including affluence, degree of rurality, employment rates and age distributions as well as transport systems, the point here is that there is very significant diversity.
The costs of action will vary quite significantly across areas as will the mix of solutions and the pace at which change can be delivered. In order for the North to be able to achieve an emissions reduction pathway which is in line with national expectations it will be important to look at the costs and trade-offs between places. Some areas may be more dependent on accelerating the greening of vehicles whereas others may be able to deliver more by mode shift. Missing targets in some of the smaller authorities will be a lower risk to overall carbon than some of the larger authorities.
5 Transport for the North: Potential Carbon Roles
This section reviews some modes through which SNTBs such as Transport for the North could intervene to support the delivery of the carbon reduction agenda. These suggestions are consistent with the activities of SNTBs but should not be taken to be endorsed by TfN.
5.1 Carbon Accounting
As Section 4 highlights, there is significant diversity in baseline emissions across the North as well as different levels of technical competence and varied accounting and assessment tools in use. TfN can, through its state of the art carbon assessment tool, provide a consistent data and analytical framework to inform its partner members’ work. This will improve transparency and reduce duplication on the complex technical task of improved carbon accounting. This would help with the important volumes of cross-authority flows as well as major freight flows in and through the region. This would be part of the Northern-level Analytical Framework, which provides new evidence and decision-support tools that can inform policy making at the local, regional and national levels.
5.2 Taking a whole area approach to value for money
Given the diversity of start points and different carbon pathways it is clear that the costs of carbon reduction are going to vary across the North. Transport for the North can play a role in developing a more coherent and better value for money pan-regional approach which takes account of the scale of the problem as well as the costs. It is not necessarily the case that the carbon pathway can be delivered through picking solutions which appear best value for money in a full appraisal. New prioritisation tools may need to be developed and different strategic cases assembled to justify action.
TfN will also be able to facilitate work across partner organisations to understand the social and distributional impacts of decarbonisation policy options with the goal of steering the transition to a fairer set of outcomes.
5.3 Understanding and coordinating technological transitions across areas
There remains considerable uncertainty about exactly what role hydrogen will paly in decarbonising heavy vehicles and how to effect such a transition. There are various hydrogen clusters across the North (including the Tees Valley hydrogen hub which the DfT is supporting). TfN could coordinate work looking at what a potential hydrogen refuelling network might look like actually on the ground. This would enable integration between the transport and economic functions of TFN, ensuring that the outcomes could promote wider clean growth opportunities for our partners. Further work could be done exploring the scaling up of the EV charging network, ensuring lessons are learnt about how charging patterns evolve with provision and where gaps and over-provision occur.
5.4 Ensuring that the embodied carbon impacts of programmes are considered
Work is already underway between DecarboN8, TfN, Highways England and Network Rail to consider the embodied emissions in infrastructure and vehicles as well as in-use emissions. This is essential to understand the full implications of a large infrastructure-based programme of work which TfN currently anticipates. The work will inform early stage assessments of the scale of impacts and influence the timing of implementation as well as the design options available if there is a case to proceed.
6 Conclusion
Carbon governance is a complex issue. There is a balance to be struck between political accountability, powers available to governmental bodies at different scales and the coherence of managing carbon emissions at those scales.
There is no one right answer. However, this paper sought to explore the potential role of Sub-National Transport Bodies. There is a strong case for SNTBs to be involved in carbon governance. The key arguments for this are:
- There is a strong coherence from a mobility perspective to understand carbon at a SNTB scale. This scale captures the majority of carbon from transport generated in that area. Smaller spatial scales are less optimal as more of the flow is through traffic and the levers to intervene on such flows more limited.
- Whilst a national approach has previously been adopted, it is clear that there is so much diversity within an SNTB area that there could be benefits to collaboration at this scale to understand when coordination is beneficial or necessary and to understand the cost and delivery trade-offs of different local approaches
- There is already groundswell of bottom up initiatives which is working against coherent carbon governance and will, in the absence of coordinating actions, lead to competition and potentially sub-optimal spend and policy outcomes.
It is worth noting that the devolved administrations of Scotland and Wales already have spatially segregated carbon governance and the emissions contributions of these administrations are smaller than many of the existing or proposed SNTBs.
However, SNTBs can only act as coordinators of the transport carbon governance picture. They lack the powers to influence carbon policy on the ground and are someway removed from the local demands for action which have led to the declarations of climate emergencies. Strong democratic accountability and political mandates to take what will amount to radical action are critical. Such mandates cannot be achieved by more technical issue-led bodies such as SNTBs where the mandate is someway removed from the electorate (despite the buy in of those partner organisations). There are also other policy areas which lower tiers of government are responsible for where carbon and other policy trade-offs and integration with transport actions need to be considered. These issues fall outside the remit of SNTBs.
Done well, SNTBs can coordinate the introduction of innovations at scale and can help improve the analytical and decision-making capacity of all of the authorities in their areas. This should enable more coherent business cases to be built which deal with the risks and trade-offs which seem inevitable given the complexity of decarbonising the transport sector and the wide diversity of start points. There are also questions on technology adoption across corridors such as the M62/Trans-Pennine where joined up action will be required. Without intervention from SNTBs it is my assessment that there will be a very uneven approach to understanding the carbon issue, coupled with strategies of differing levels of ambition which, in turn, will raise tensions about resourcing to back those up.
[1] https://www.local.gov.uk/decarbonising-transport-getting-carbon-ambition-right
[2] Department for Transport (2020) Decarbonising Transport: Setting the Challenge and BEIS (2019) 2018 Greenhouse Gas Emissions, Provisional Figures
[3] The measure is based on the percentage reductions in standard error of the rank change in going from all roads to minor only. 100% is the reduction in standard error going from districts to SNTBs
[4] Adeel, M., Wadud. Z. and Anable, J. ‘An exploratory analysis of long distance travel in England’, 99th Annual Meeting of the Transportation Research Board (TRB), Jan 2020, Washington DC